
When we discuss about population we consider:
- Birth rate and fertility rate. Birth rate is defined as the number of births in a population during a period of time. It is measured by the crude birth rate. Nowadays, world´s birth rate is 20/00 although the level of development of a country determines its birth rate.

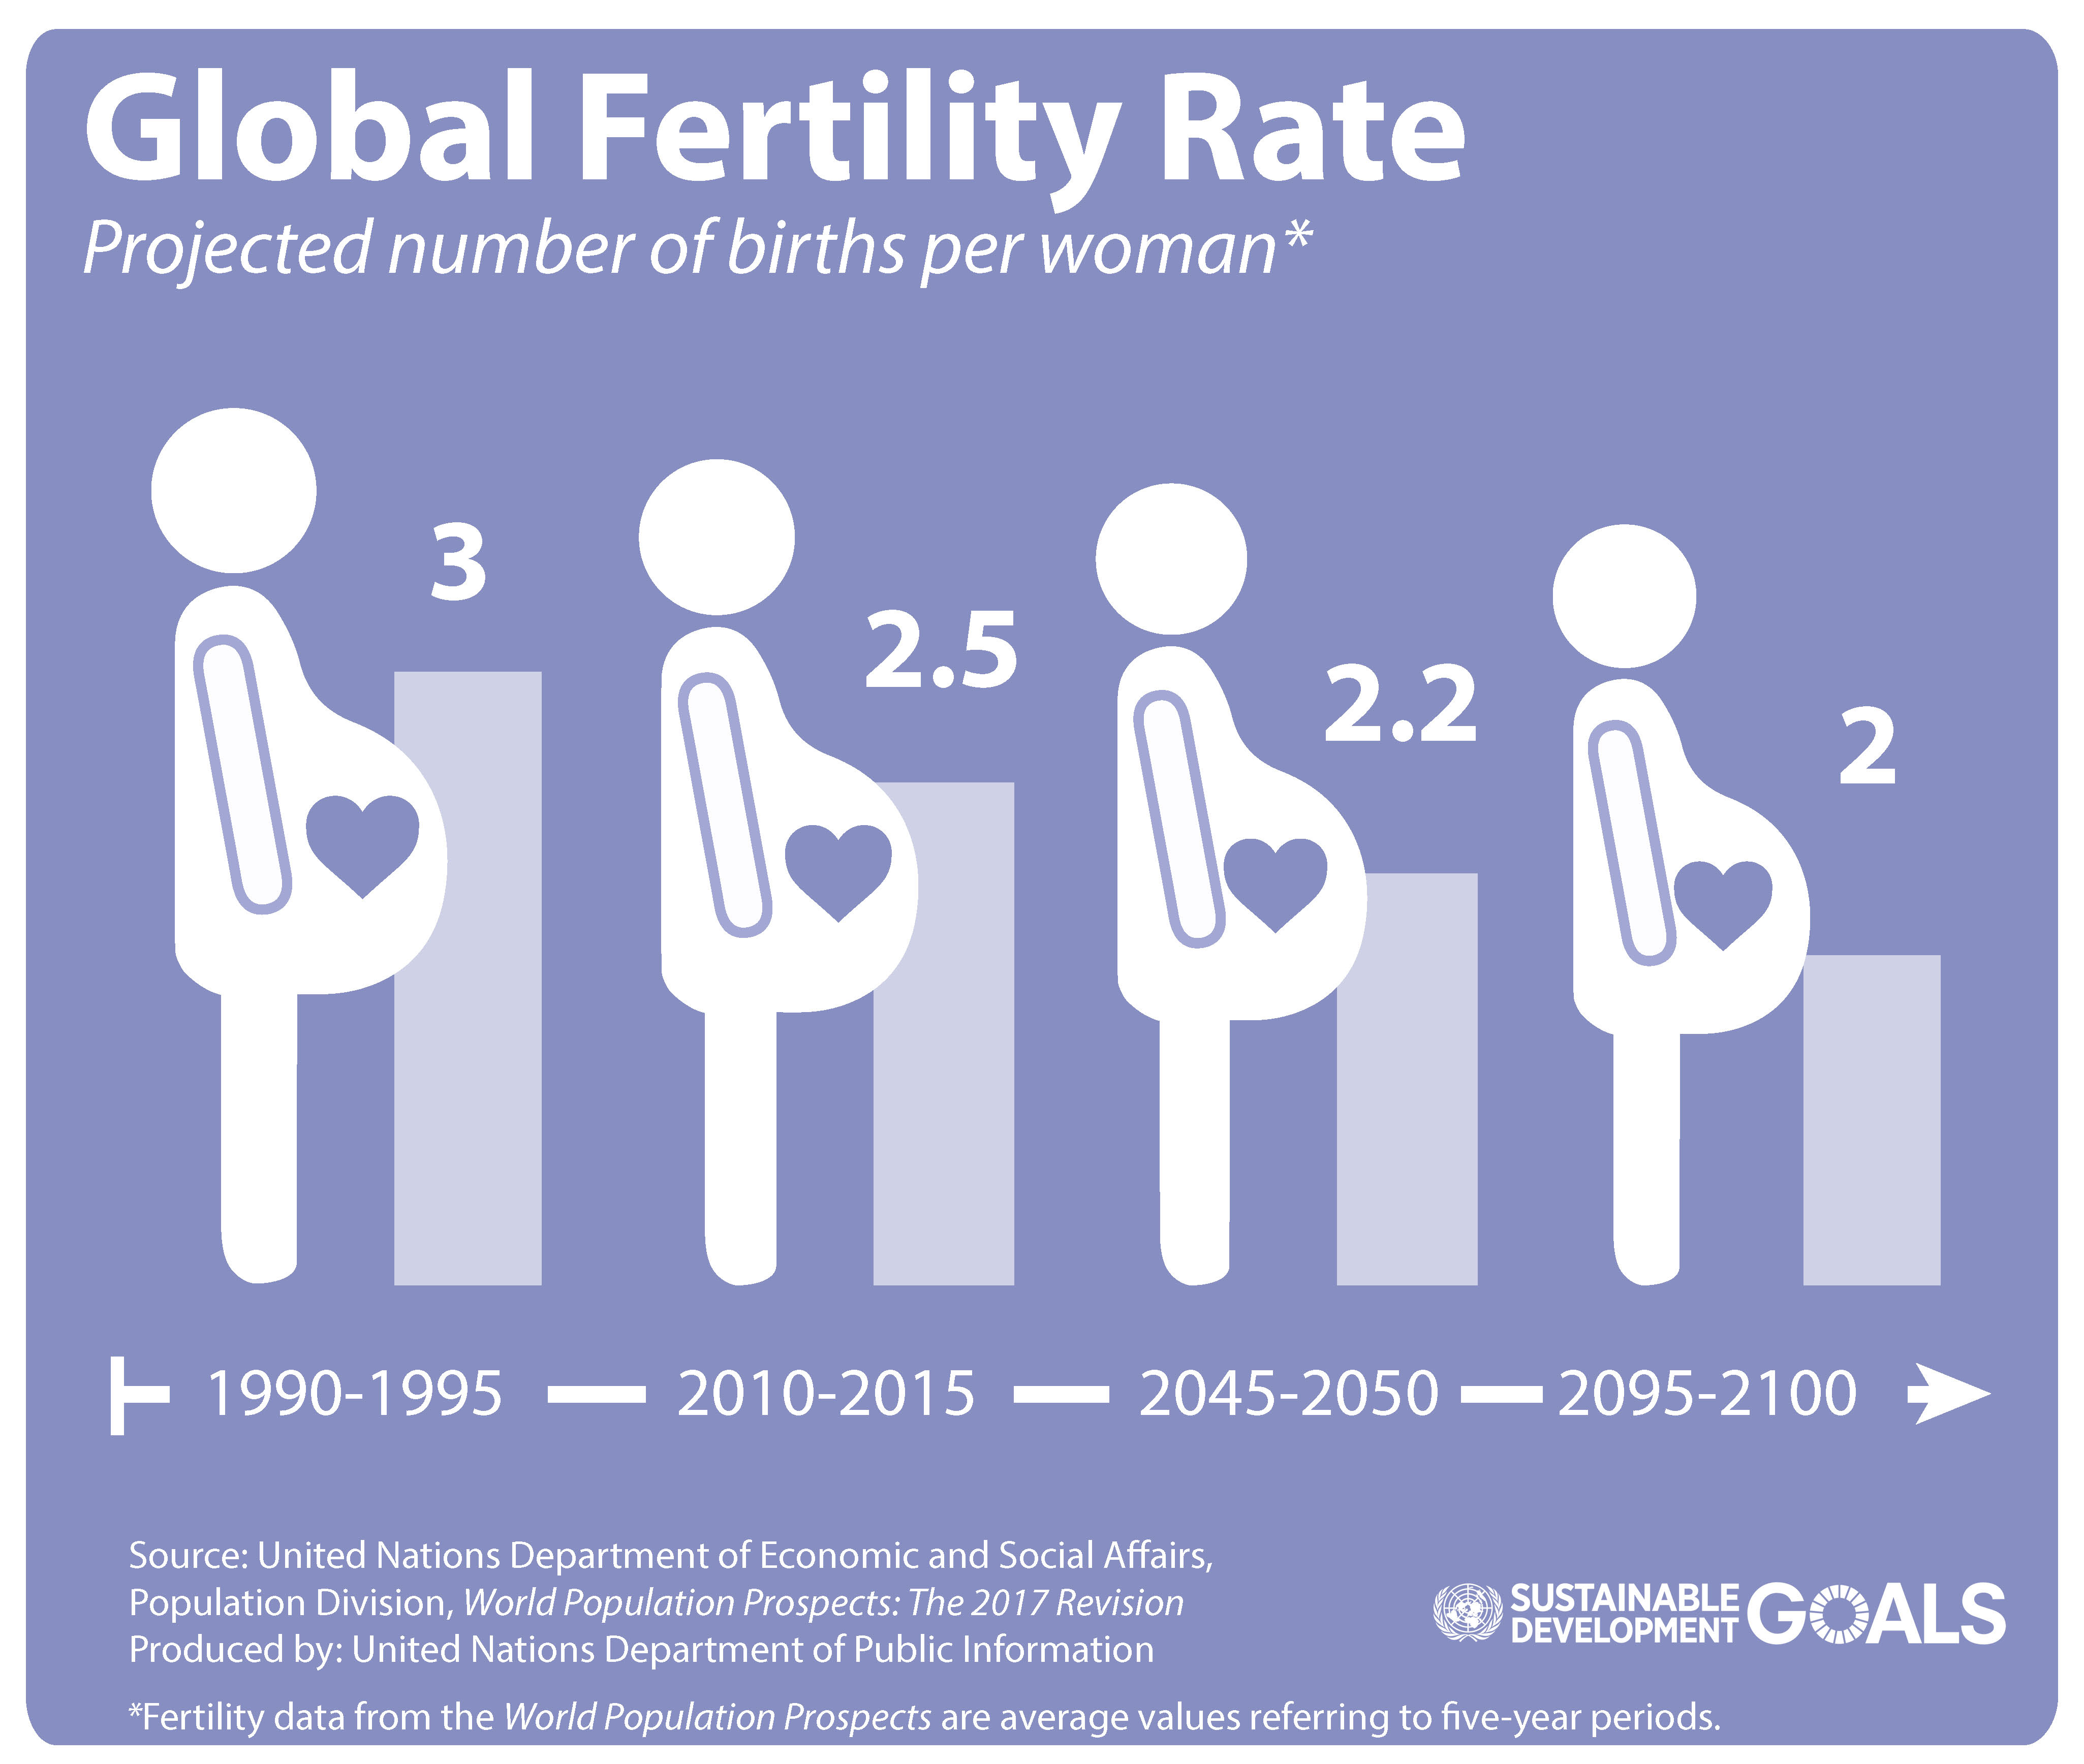
The fertility rate is the estimation of the average number of children a woman has in her lifetime. The minimum children per women to grant generational replacement is 2.1 children. However, in developed countries fertility rate is about 1,6 children per woman.
CRUDE BIRTH RATE OR CBR
NUMBER OF BIRTHS
CBR = —————————————————- X 1,000
NUMBER OF INHABITANTS
- Death rate could be defined as the number of deaths in a population during a specific period of time. The crude death rate is the indicator to measure death rate. Death rate has been falling and at the moment global death rate is 8 %0 although there are big differences between countries.
A direct consequence of crude death rate is life expectancy which has increased, and it is about 70 years. Life expectancy is the average number of years a person is expected to live.

CRUDE DEATH RATE
NUMBER OF DEATHS
CDR = ———————————————————— X 1000
NUMBER OF INHABITANTS
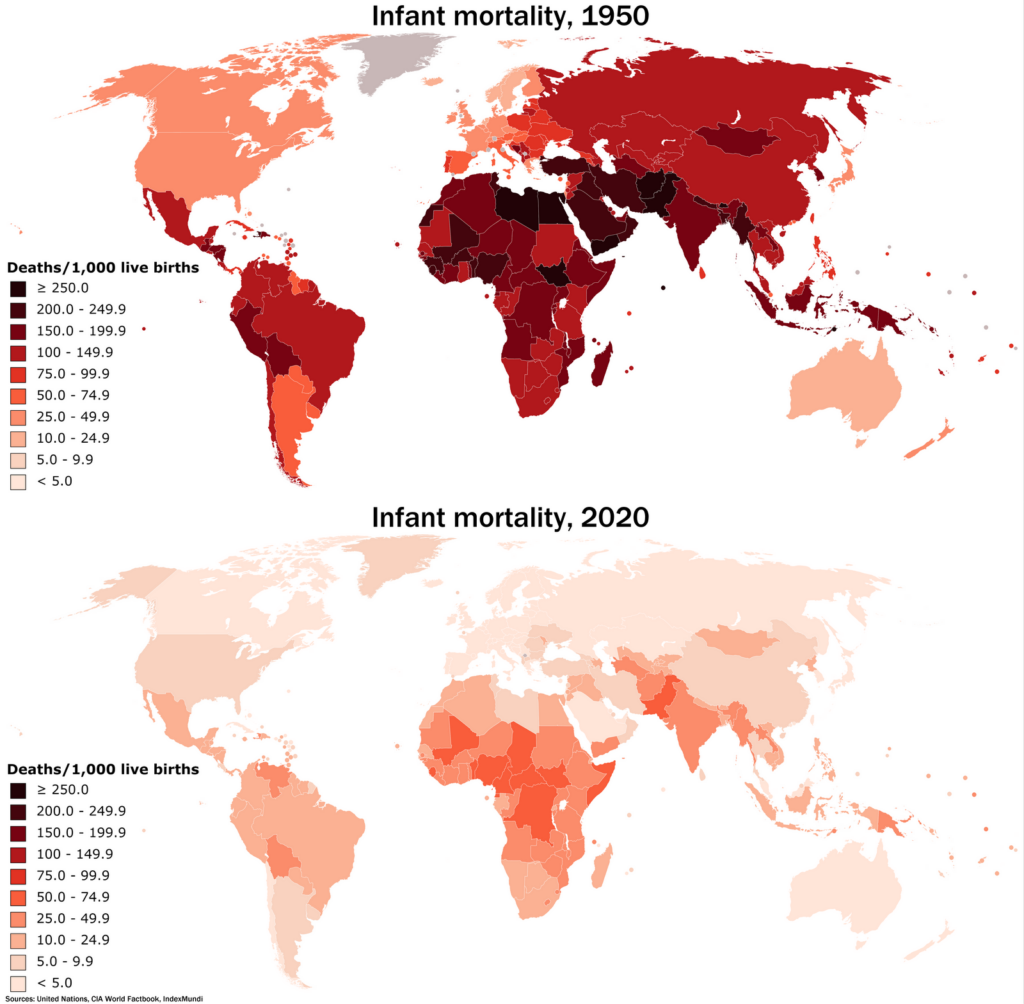
CHILD MORTALITY RATE
NUMBER OF DEATHS UNDER ONE YEAR
CMR = ——————————————————————- X 1000
NUMBER OF LIVE BIRTHS
- The natural increase. Natural population growth is the difference of births and deaths. Obviously, if the result is positive, population grows. Rate of natural increase (RNI) measures the natural increase of the population. A high natural increase is over 2% while a low natural increase is below 1%. Today´s natural increase in the world is about 1.2%. Net migration influences the real population growth.

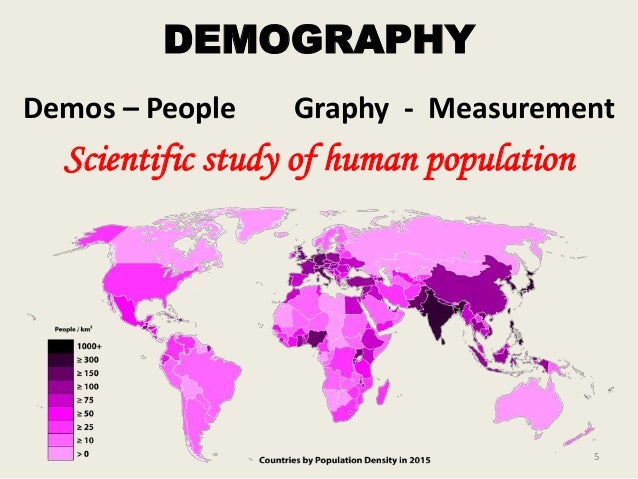
POPULATION DENSITY
Population density describes how crowded is a place. It is calculated by dividing the total population of a place by its area. Densely populated countries have more than 50 people per KM2 while sparsely populated country has less than 10 people per km2.
The formula to calculate it is:
NUMBER OF INHABITANTS
POPULATION DENSITY = ——————————————————-
SURFACE AREA

- POPULATION STRUCTURE
A complete demographic study includes the structure of the population based on age and gender.
- Age: population is divided in three groups:
- Young population from 0 to 14 years.
- Working population from 15 to 64 years.
- Older population from 65.
- Gender when population is classified into males and females.
